How-to

How to Pick the Right Respondents for Your Survey

In our blog on Choosing the right sample size”, we provided a formula to ensure your target population is represented accurately. Knowing that number early is important for determining your mail quantity and bidding out your project to vendors. However, it is only half the equation in survey sampling. The other half is making sure you pick the right people.  

So how do you choose the participants? 

1. Define Your Target Population

Before you can choose survey participants, you need to define the common binding characteristics or traits of the overall population. For example, “government employees” or “existing customers.” These are often combined with other characteristics: “government employees who use iPhones” or “existing customers who have utilized a particular service.” It is imperative to select the most appropriate target population to satisfy the objectives of the survey. 


2. Identify Your List Source

Some survey samples are easier to generate than others. For example, if you are surveying your existing customers, you likely already have everything you need in your company database. But if your target is “Latina women 25-40 who shop online,” you may have some work to do. In this case, you may want to look for available public data or purchase a list from a sample provider. Once you determine the list you need, then you become better positioned to choose a sampling method and pick your respondents. 


3. Choose a Sampling Method

There are many scientific ways to select a sample. They can be divided into two groups: probability and non-probability sampling. Probability sampling is any method that utilizes random selection like drawing straws or randomized computer selection. Everyone in a target group has an equal probability of being chosen. It is the preferred method of researchers because it accounts for bias and sampling error. 

But sometimes probability sampling is not feasible, either due to time constraints or list accessibility. In that case, non-probability sampling is used. People must still meet common binding criteria, but they are chosen in such places as a mall or a busy neighborhood. Such samples are often useful but don’t account as easily for bias and sampling error. 

Depending on the needs of your study, you will typically choose from one of the following common methods:

  1. Random SamplingThe purest form of probability sampling. The most basic example of this technique would be the lottery method.
  2. Stratified SamplingIdentifies a subset of the target population such as fathers, teachers, females, etc., and selects them at random.
  3. Systematic SamplingUses every Nth name in a target list, where N is a variable of your choosing.
  4. Convenience SamplingA non-probability method used when only a few members of the target population are available. 
  5. Quota SamplingUses subset criteria like stratified, but doesn’t randomize their selection. 
  6. Purposive Sampling A method that uses predefined criteria with a purpose in mind. For example, gauging the perceptions of Caucasian females between 30-40 years old on a new product but not randomize their selection.

Survey sampling is a critical part of data collection. Your survey provider can help you weigh these options for your survey to ensure you get the quality data you need. For more information on survey sampling or any aspect of mail survey management, contact us today!

By |2020-03-30T19:45:29+00:00January 13th, 2020|Survey Research Services|0 Comments

Creating a Data Schema

At long last, you’ve made it to the data collection stage of your survey project. It’s time to warm up the automated data collection equipment, make sure everything is programmed correctly and prepare for the results to come in.

As with each stage of survey administration, there is some prep work needed to ensure accurate outcomes. In the case of automated data collection, it all begins with the Data Schema.   

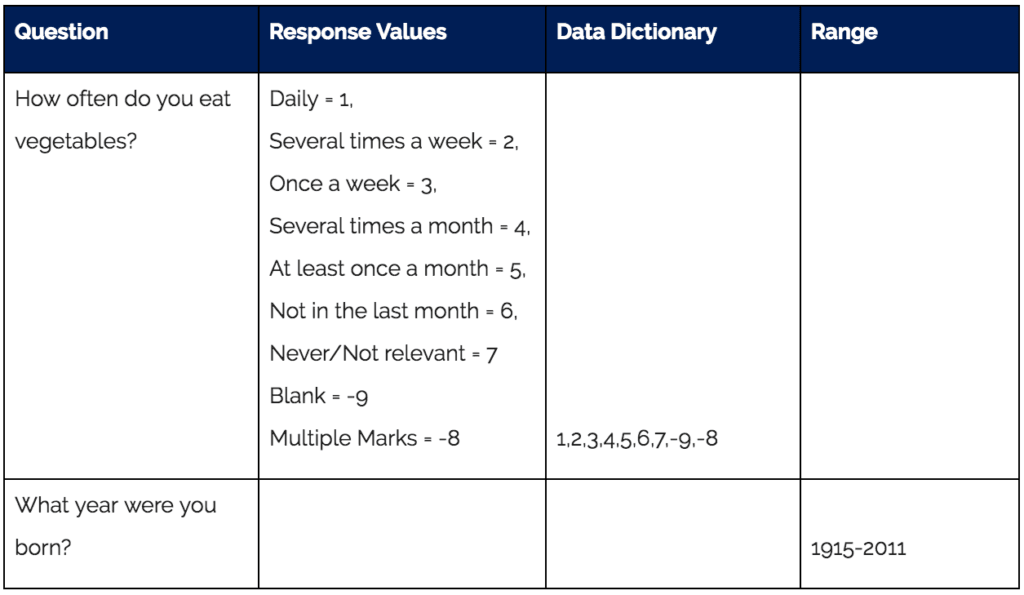
A Data Schema is a blueprint of what all the numbers mean in the data file you will get with your results (see chart below). The good news is that you get to design this to your liking.

You will assign a value to each response (i.e, “1 = Daily”; “2 = Several times a week,” etc). We recommend you Include values for “blank” and “multi marks,” as shown in the chart below as -9 and -8, respectively. You will also want to include ranges where applicable. For example, if you are surveying teenagers and asking the year they were born, you can put a range on the year that you are expecting. If a date comes up out of range, the automation will stop for an operator to confirm the entry and ensure there was not a substitution error.

As part of your data schema, we highly recommend you include a data dictionary (see 3rd column in chart below). This identifies all the expected values for that question.

Data Schema

The data dictionary column allows you to easily build a query to check for values that are out of range.

Sample Data Testing

After your survey is programmed, the testing begins. Programmatic testing against the data schema ensures that your multi-modal data collection will run seamlessly and that the resulting data is delivered in a format you can use. Your data collection partner will specifically test for:

    • Coding – Did it code correctly?
    • Exporting – Did it export correctly?
  • Formatting – Can the customer work with the data as supplied or do they need something changed or adjusted

We start with a test that accounts for all possible survey responses. (The total number of surveys filled out is equal to the maximum number of response choices on the survey, plus 2). To test this, we fill out one survey with all the first response choices marked. Then we fill out a second survey with all the second response choices, etc.  We follow this up with a test to account for multiple marks entered on single response items, another with test text entered for comment style questions, and finally, one for “mark all that apply” questions. By testing for all possible response types, we ensure that all questions are programmed correctly.

The next test involves data sampling (i.e, using a small subset of your respondent population to collect data). We do a mixed response test with live forms filled out by a respondent subset to ensure nothing unexpected occurs in the way respondents are filling out the forms. For example, we might see that many people are selecting multiple responses to a single response question. This gives us the opportunity to alter the programming to capture all responses.

The Data Schema is an essential part of data collection programming, testing and processing. By creating an impeccable blueprint and investing the time to properly test samples, you will ensure the integrity of your results and safeguard against the pain of data loss!

For more information on data schemas, data collection or any aspect of survey mail management, contact us today!

By |2019-03-20T10:56:38+00:00October 9th, 2018|Data Capture Services|0 Comments