Zoula

About Zoula Shalice

This author has not yet filled in any details.
So far Zoula Shalice has created 9 blog entries.

Effects of Badly Worded Survey Questions  

In questionnaire design text, it is both important that question-wording should express what is being measured, and that appropriate response options are provided. However, there are times the latter is overlooked, and a mismatch occurs between the question wording and response options. So, the big question is, how detrimental are these mismatches? Below, we discuss the effects of badly worded survey questions (how mismatches between survey questions and response options affect a study). We hope this information will help you weigh whether it is more critical for questionnaires to firmly match survey wording, or give more significance to more straightforward and less wordy options.

Common Sample of Mismatched Questions

effects of badly worded survey questions

effects of badly worded survey questions

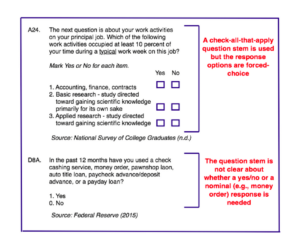
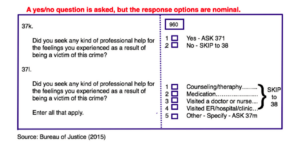
Effect of Mismatched Questions

  • Higher Item Nonresponse

Mismatched questions will result in higher item nonresponse because of the difficulty in responding due to additional cognitive processing. In responding to survey questions, respondents must identify the question, understand it, recover relevant information, create a judgment, and then report (Jenkins and Dillman 1997; Tourangeau, Rips, and Rasinski 2000). Consequently, there is a probability some respondents will skip items, or refuse to answer when they are troubled to exert additional intellectual effort. In an experiment by Dillman et al. (2014), they found that the mismatched version caused greater item nonresponse, and differences in response distributions, compared to the matched version. The study varied the question stems paired with forced-choice response options to be matched or mismatched with check-all question stems.

  • Longer Response Time

Mismatched versions will take longer to finish compared to matched versions because of the added time-consuming comprehension and mapping complications. Additionally, the mismatch may only be identified by the respondents when they are mapping their answer to the response options and determine they are not appropriate. In this case, they have to exert additional effort in finding an adequate answer in the response option to replace their answer. Van der Zouwen and Dijkstra (2002) determined that mismatches or poorly designed response options (inadequate range of response alternatives) were greatly connected with swaying from the classic interviewer/respondent interaction in a question/answer sequence. An example of a classic interaction is an interviewer asking exactly worded questions to respondents, and receiving an adequate answer from them. Mismatch tends to result in respondents asking the interviewer to clarify their question further, resulting in longer survey completion time.  

Confirmation by a Recent Study of the University of Nebraska-Lincoln: “The Effects of Mismatches Between Survey Question Stems and Response Options on Data Quality and Responses”

The experiment divided the respondents into two groups. The first group received a survey version with all answer options and response options matched, and the 2nd group a slightly mismatched version. Their theory was that mismatched questions would result in higher item nonresponse and longer response time.

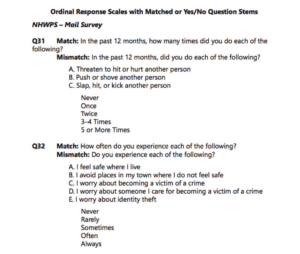
Example Matched and Mismatched Survey Questions from the Study

Results of the Study

The item nonresponse rate is higher in the mismatched than in the matched version. The probability of an item being unanswered in the mismatched version compared to the matched version is 1.6 times. 

Response time was longer in the mismatched than in the matched version. During the survey conducted via telephone interview, the researchers found that the interviewees took more time to complete the mismatched version, compared to the correctly matched one. 

The effect of the mismatch is not greater for those with lower cognitive abilities based on age or education. 

Summary

The study confirmed that mismatches weaken data quality in both mail and telephone surveys. Although, it may be less detrimental for the mail survey because it is self-administered, and respondents can see both question stem and response options. Researchers should design their questionnaires carefully, taking into consideration the proper relationship of the question stem and response option. Moreover, in analyzing survey results, researchers should review both stem questions and response options to determine if a mismatch could have made an impact on the results. 

For more information on Survey Design, survey mailing services, and data capture services, quantitative data collection services in general, contact us!

By |2020-06-27T08:58:34+00:00June 20th, 2020|Survey Research Services|0 Comments

Reasons to Avoid Sending Mail Surveys During the Holidays

Many experts believe that the holidays are a bad time to ask people to participate in survey research, yet there are still some that will insist they’ve garnered better results during the holiday season. However, despite the success of some people in research during the holidays, we at DataForce Survey and Study Management still do not recommend sending mail surveys so close to the holiday. Below are two of the main reasons we urge you to think twice. 

1. People Are More Stressed During the Holidays

Avoid Sending Mail Surveys During the Holidays

A 2015 Healthline survey that measured holiday stress confirms that the majority of respondents were under stress. According to the results of the survey, 65 percent of generation X, 61 percent of millennials, and 62% percent of baby boomers feel some stress during the holidays. 

When your audience is more stressed they are less likely to show interest in your mail survey. Their mind is more focused on picking the right gift, finances, holiday schedule, and so on. Although you may still receive survey response, it will undoubtedly be lower in quantity and quality than when your audience is in a period in time where they are under less pressure. 

2. A Quarter of Americans Plan to Travel During the Holidays 

Avoid Sending Mail Surveys During the Holidays

According to a survey of more than 1,000 adults conducted by Experian, 1-in-4 Americans plan to travel during the holidays. Among those leaving their home for some R and R, Gen X-ers and millennials will be the ones to travel the most. 38% of Millennials and 35% of Gen X-ers said they typically hit the road during the holiday season, while only 16% of Baby Boomers and 11% of Gen Z members said they travel at this time. During the holidays, your target audience might be out of their house. Your response rate will likely experience a decline by at least a few percentage points as a consequence. 

If you send out your packets during the holidays, there is also a good possibility that your respondents will leave their mail to pile up, and in an effort to catch up, throw out the ones that are least relevant into getting them back on track in their regular daily routine. Hence, the odds that your survey packet will be included with the mail thrown in the trash bin will be quite high. 

If you cannot avoid sending out that mail survey during the holidays, here are our recommendations:

The delivery and return of holiday mail take longer. And, since potential participants are busy and distracted with the season, they tend to put off answering surveys. If you must send out your surveys during a holiday, allow additional time for returns. Most survey projects see the first set of results around 7 – 10 days after mailing, with the bulk of responses coming in between 14 – 18 days after the mailing date. If you are mailing your project around a holiday though, it is better to plan for an additional 1 – 2 weeks for responses, and expect them to be a little lower. 

Check out our post on 3 Tips to Streamline Your Survey Return Schedule

Sending mail surveys during the holidays is not the best idea or strategy to increase your response rate. However, we understand there are situations when you still have to take this course of action. Our mail survey experts at DataForce can help you plan, prepare, and execute your mail survey confidently and flawlessly during this period. For more information on survey fulfillment or any aspect of mail survey management, contact us today!


Check out – forms processing services, incentive fulfillment services

By |2020-06-21T15:36:42+00:00June 20th, 2020|Survey Mailing Services|0 Comments

Tips in Managing a Long Survey

One of the main reasons people don’t complete surveys is because they are too long and complicated. A long and complicated survey is like torture to potential respondents; it’s simply demotivating. If that’s what you’re aiming for, then go ahead and launch that survey. But I certainly don’t think that is anyone’s goal in creating their survey. So, if you’re struggling with a lengthy survey check out these tips and see how they can help you. 

Turn that Catastrophic Long and Complicated Survey into an Ideal Short and Clean Mail Survey

A long survey is an instant no-no for most respondents unless, of course, you are providing a significant incentive. And those respondents that do continue to answer a long survey, well, a study has found that after 15-20 minutes of answering survey questions, data quality is reduced by more than 10%. In short, a long survey can result in a reduction in response rate or data quality. To avoid this scenario, keep your survey length to no more than 15 minutes. Below are some tips to use when a long survey challenges you:

1. Categorize Questions into Crucial, Beneficial, and Expendable

Managing a Long Survey

Categorize your questions in relation to their necessity in answering the research goals and objectives:  Crucial, Beneficial, and Expendable questions. Crucial questions stay, and expendable questions are eliminated. In the middle are beneficial questions that assist in understanding the problem, but are not necessary for answering the objective and goals. They are temporarily removed and returned only when some room is left after all crucial questions have been listed. After the purging, the next step is to check the analysis of the survey, with and without the excluded questions.  This step is vital to determine if there will be a significant difference in the analysis after the changes. 

Moreover, think about adding the questions that were removed on a follow-up survey. A follow-up survey can be done through the same survey distribution method or something more convenient to the respondents, for example, online.

2. Multiple Survey Versions for Respondents

Managing a Long Survey

A second solution would be to create multiple versions of the survey. Let’s say you have 50 items on pharma products. You have 20 questions for your core questionnaire, and the remaining 30 questions are for three different products (10 questions each). Hence, you can create three versions of the questionnaire for each product. Each respondent will get the core questions and the questions for a single product. Consequently, you get data for all three products.  

Things to consider in creating multiple versions of the survey:

  1. Which respondent gets what survey should be picked randomly to avoid bias.
  2. Make sure that you have enough samples to ensure that you get enough responses for each version.

3. Utilize Background Variables

Managing a Long Survey

  • Don’t ask about things you already know and instead use it to your advantage. These are called “background variables”. When possible, it is best to filter your respondents with these variables. You don’t want to turn off respondents from answering a survey due to length when 20% of the questions don’t even apply to them. For example, you have a questionnaire where you want to determine the impact of medication to patients over 40, and 10% of the questions are only for patients who have done a particular treatment. If you have the list of the respondents who have had the treatment beforehand, you can provide the core questionnaire to all respondents and only offer the additional questions to the respondents who have had the treatment. This simple method can reduce survey rejection, as well as printing costs. You can also use the information you already have to personalize your materials (e.g., invite, cover letter, or survey).
  • Screen the answer list. If possible, respondents should only have response options applicable to them. For example, don’t provide feedback choices on the complete product list but only services applicable to the potential respondent.


A Checklist in Keeping your Mail Survey Clean and Simple

Managing a Long Survey

Keeping your survey clean and simple is crucial for respondents to comprehend questions and answer them accurately. If the survey questions are confusing, then the answers of the respondents may become distorted; hence, the research is compromised. To help you out, below is a Checklist in Keeping your Survey Clean and Simple: 

  1. Make sure the instructions are clear and accurate. Don’t make assumptions that the respondents already know what to do. Give examples.
  2. Avoid technical terms that will confuse your respondents. The language used should reflect how respondents think and talk regarding the subject.
  3. Easier Questions should come first. Place easier questions before the complex ones. Give respondents time to become comfortable answering the survey questions. In doing so, the probability of them answering the complex questions will increase.
  4. Each Question should be focused and intended for a particular feedback
    • Don’t use double-barrel questions:”
      • “Would you recommend our products and services to your friends?”
      • Instead, separate them into two questions:
        • “Would you recommend our products to your friends?”
        • “Would you recommend our services to your friends?”
        • These will provide an equal focus on both subjects.
  5.  Keep Questions precise. Actual numbers should be used. Avoid general response choices like “sometimes” and “rarely” in the survey form
    • For example: “less than 2 times per day”
  6.  Proofread the Survey. Check the survey for improper words, grammatical errors, and incorrect spelling. Mistakes such as this show unprofessionalism, and can devalue your survey. After proofreading the survey yourself, have someone else check it. Preferably, someone that is not familiar with your study, this process could flush out confusing terms or directions. You can also use special apps online, such as Grammarly proofreader.
  7. Test your Survey. Testing is a necessity despite how good you think your survey design and proofreading skills are. This is your last opportunity to fix errors before they become a big problem for your study.

There you have it. Effective Tips on How to Keep Your Mail Survey Short and Clean. And while they will certainly help improve your response rates, there are still other elements you might want to consider for a successful Mail Survey Project. Check out our Mail Survey Spec Sheet that will help you document the list size, number of mailings, type and quantity of materials that will be needed, budget and requirements for each mailing. This spreadsheet will help organize and calculate the materials across your mailings. Download the Spec Sheet here!

Partner with a Data Collection Solutions Provider

DataForce works with you to design forms that are ideal for obtaining the data you need. Our survey designers specialize in creating professional forms that are both functional and visually appealing and generate high response rates and impeccable results. We provide outstanding Survey Research Services and Survey Mailing Services.  Contact us now so we can help in the success of your Survey Project.

By |2020-06-20T18:09:03+00:00June 20th, 2020|Survey Mailing Services|0 Comments

Five Ways to Avoid Survey Response Fatigue

We are now in an age where sending feedback requests or surveys has never been so easy. Technology has made online surveys popular and has streamlined telephone and mail surveys to be convenient as well. Target audiences are being flooded by survey requests that survey fatigue is inevitably happening.

Survey fatigue occurs when people are discouraged in responding to surveys because they are overwhelmed with the number of questions on a survey or bombarded with numerous surveys. In fact, in 2012, a report was made by Pew Research, their telephone survey response rates have dropped from 36% in 1997 to a mere 9%. With these results, it is essential to understand how to reduce survey response fatigue to improve overall survey response rates. Below we’ve listed five ways to avoid survey response fatigue for the benefit of your data collection project.

1. Filter Questions

WAYS TO AVOID SURVEY RESPONSE FATIGUE

Create surveys that will provide you with the most relevant and needed information. Remove unnecessary questions and use responses on earlier questions to further filter the survey from items that are looking for similar answers (although the way of questioning is different). Avoid gathering as much data as you can on a survey, instead keep your questions focused on meeting your survey goals.  


2. Time Your Survey

WAYS TO AVOID SURVEY RESPONSE FATIGUE

Fewer questions do not automatically mean a shorter time for respondents to answer the survey. The survey questions’ complexity is a significant factor, so make sure to test the survey and how long it takes to finish. Surveys that take too long can tire participants, which results in lower quality data, non-completion, or total abandonment.

Manage expectations by advising respondents on how long the survey will take before they begin. 


3. Keep Your Respondents in Mind

Focus not just on your research goals but on the people who will be providing data. Think about how they will feel about the questions, survey layout, and response options. Make notes on challenges or roadblocks the respondents may encounter, as well as check for bias in questions and remove them. Balancing the demand from stakeholders for additional data while maintaining a level of empathy will ultimately give you better data.

4. Communicate the Value 

WAYS TO AVOID SURVEY RESPONSE FATIGUE

A study by Vision Critical determined that people are more likely to do a survey when they feel their opinion matters. Accordingly, a majority of the respondents (87%) claim they took the survey because they believed it would contribute to making a difference in a company’s product or services. For example: Advising respondents that the survey will help the business create their new menu will motivate respondents to participate, especially regular customers. It would also be helpful if the request came from someone with authority, like the owner of the establishment, to emphasize the importance of the survey. 


5. Show Appreciation

WAYS TO AVOID SURVEY RESPONSE FATIGUE

Value the time and effort of your respondents. Provide respondents with incentives such as cash, promotion, or gift card. Check out our post on 3 Survey Incentives to Explode Your Response Rate. Another way to show appreciation is by allowing them to find out the results of the survey. Post the results online and reveal how the survey results are improving the brand.  

There you have it, Five Ways to Avoid Survey Response Fatigue for your respondents to have a more pleasant survey experience, and get you higher response rates and quality data.

For more information on survey research services, Mail Surveys and Data Collection in general, contact DataForce!

By |2020-06-22T20:41:30+00:00June 20th, 2020|Survey Mailing Services|0 Comments

What Survey Mode is Best for My Project

While there are many tools available for data collection, surveying is one of the most commonly used. Surveying is essentially a research method used to gather data from a sample of people to generalize results to a larger population and gain insights on various topics. Questionnaires are used in asking people for information in a survey. As compared to other data collection methods, such as direct observation and experimentation, surveys yield a broader range of information. The most common survey types by distribution are online, telephone, face-to-face, and mail survey.


Types of Survey


1. Online Survey

Different Types of Survey


Technology has enabled online surveys to become the most popular and cost-effective type of survey. The questionnaire can be completed with a smartphone, tablet, or computer so long as the respondent has access to the internet. 

a. Advantages: 

  • Reach of the survey has increased to wherever there is internet access.
  • No limit to the type of questions that can be asked.
  • Data collection and data analysis is now structured and easy to manage.
  • Ideal for short, simple surveys.
  • Quick results.

b. Disadvantages:

  • We receive requests to take online surveys frequently, whether you make a purchase from Amazon, pick up lunch at McDonald’s or take a class; everyone wants us to take their online survey. This saturation has contributed to survey fatigue, and people are only doing online surveys if they are unhappy or related to something meaningful to them.
  • Inboxes are inundated nowadays; we are busy looking for the things that need our attention and delete or skip the other ‘stuff.’
  • People are hesitant to click on links that come from people they don’t know, they don’t want their information stolen or their computer hacked. 


2. Telephone Survey


The medium used to contact respondents is the telephone. An interviewer follows a script in asking a specific set of questions to the respondents, and a data entry software is used to record the respondent’s answers. 

a. Advantages:

  • Relatively cheaper and less time consuming than face to face surveys. 
  • Extensive geographic access since most people in the United States have a telephone or cellphone. 
  • Easy access to in-house or online phone directories. Phone numbers can easily be purchased from sample companies. 
  • Time effective since interviewers can just keep calling numbers until they reach their quota.
  • Skilled interviewers can elicit longer or more complete answers. Interviewers can also ask for clarifications of unclear responses.  

b. Disadvantages:

  • Hard to make a connection with people since interviewers can’t see the person’s reaction. 
  • Intrusive, since most of the time, telephone surveys are done without notice. The interviewer might be interrupting the respondent’s plan for the day. The researcher must carefully consider the time and length of the call.
  • Interviewers may be perceived as telemarketers and, consequently, turn-off respondents. 
  • Regulations must be followed to avoid significant fines.


3. Face-to-Face Interview

Different Types of Survey


Face-to-Face surveys are one of the oldest and most widely used survey types. The researcher typically interviews in the home, office, hangout place, etc. of the target respondent. This is by far the most personal approach and best used if you are looking to raise trust and cooperation from respondents. Interviewers must be trained well, including on how to read non-verbal cues to direct the interview better.

a. Advantages  

  • Can capture verbal and non-verbal cues. The interviewer can gauge if body language and facial expressions match the participant’s answer.
  • The interviewer can make sure that the participant is committed and encouraged to finish the survey.
  • The interviewer can provide assistance in case the participant is confused about any part of the survey or question.
  • The interviewer can take advantage of the five senses. Aside from audio and visual stimuli, the researcher can also let respondents touch, taste, and smell materials to support the interview.

b. Disadvantages

  • A face-to-face survey can take longer. Interviews can last for days or weeks, depending on the number of respondents needed and their availability.
  • Considerably more expensive than paper, online, and telephone. Training, travel, and material are some of the principal costs. 
  • The quality of data depends on the skill of interviewers. 
  • It requires more effort to plan and manage.


4. Mail Survey 

Different Types of Survey


For reasons of cost and ease of implementation, mail surveys are more frequently used for social research than are either telephone or face-to-face interviews, according to Don Dillman.  Before online surveys, 69% of surveys were conducted solely by mail and another 11% were a combination of mail and some other mode. 

a. Advantages

  • It can be used when the respondent’s internet access or knowledge is limited.
  • Less expensive than Face-to-Face or Telephone surveys.
  • Allows respondents to complete the survey at their convenience. 
  • A hard copy serves as a reminder to finish the survey.
  • Research shows that respondents give more honest answers when compared to other modes.
  • Respondents trust mail surveys more than online surveys since we are told not to click on links from people/organizations that we don’t know. 
  • You have less competition with someone’s mailbox than you do with their inbox.
  • Best for capturing sensitive information or long, complex surveys.

b. Disadvantages

  • Respondents may not follow directions or only answer certain questions, leaving an incomplete response.
  • It takes more time than online surveys to collect the data.
  • If your study requires alternate question sets or alternating question order, paper surveys may be too costly to support this requirement.

Check out our earlier post on Why Mail Surveys are Thriving in the Digital Age.


How to Select the Best Survey Type for Your Research


1. Consider Population and Sampling

Define the characteristics of the target respondents that belong to your population before you choose a survey method. Determine geographics, language, communication, literacy, and other issues that might arise. For example, if your target respondents are older people, you may choose a mail survey; however, if the target population is younger or more tech-savvy, an online survey might be more appealing.  

2. Determine Question Types 

In selecting the right survey method, the questions that the respondents need to answer should be considered. Paper or mail surveys can be ideal for mostly closed-ended questions, while a survey with plenty of open-ended questions that could require a follow-up may require a face-to-face or telephone interview.  

3. Check your budget

You have to justify the cost of the type of survey you will choose. You may want to do a face-to-face interview, but the costs compared to a mail survey may not validate the benefit of pursuing face-to-face interviews. 

4. Establish your timeline

Some survey methods take longer to complete than others. If you are in a rush, then an online survey is your best bet. However, if time is not a significant factor, then you can do a mail survey.

5. Check Access to Facilities and Resources

Do you have the facilities, equipment, and human resources needed for your survey to run smoothly? If you plan to do a mail survey, you need access to printers, human resources or equipment for stuffing envelopes, data processing software, warehousing, and so on. For telephone surveys, you need well-trained interviewers, phone equipment, CATI software, etc.  

It’s important to know which survey type to use and when to use it. Once you’re familiar with the different survey types, you’ll be able to focus on what you need to make your survey distribution as smooth as it can get, getting you far better results than ever before. For more information on data collection techniques or any aspect of mail survey management, contact us today! We provide outstanding quantitative data collection services and paper scanning services!

By |2020-05-19T21:44:22+00:00May 19th, 2020|Survey Research Services|0 Comments

What is a Likert Scale and How to Create One

Are you interested in finding out what you can use to measure questions that are neither agreed nor disagreed? A Likert scale can help you measure attitudes and opinions with a greater degree of nuance than simple binary questions, which offer only two answer options. Please read our blog post to learn what is a Likert scale and how to create one for your next survey.

1. What is a Likert scale? 

The Likert scale is one of the most popular rating scales developed to measure one’s attitudes or opinions. Fixed choice response formats are used to determine how people feel about the topic, products, services, or experience. The scale deems that the strength/intensity of the experience is linear. These linear scales measure points of agreement/disagreement. People are given five to seven choices, or even nine balanced responses, that often come with a neutral point. 


2. Common Likert Scale Question

A Likert scale does not have a fixed number of leveled items. Many researchers use five levels, but some also use 4, 7, 9, and even 10-leveled items. Since adding more levels produces diverse valuations, a 5 or 7 level scale is most often ideal for avoiding extreme options by obtaining just a bit of variation.

Below are some examples of Likert scale questions and answers:

a. Agreement

The employee training provided the knowledge I need to do my work efficiently.

  • Strongly Disagree
  • Disagree
  • Undecided
  • Agree
  • Strongly Agree

b. Satisfaction

How satisfied are you with our customer support?

  • Highly Dissatisfied
  • Dissatisfied
  • Neutral
  • Satisfied
  • Highly Satisfied

c. Frequency

How often do you visit our store?

  • Very Frequently
  • Frequently
  • Occasionally
  • Rarely
  • Never


3. When to Use Likert Scales

What is a Likert Scale

Likert scale is useful in measuring the general feeling or opinion of a particular topic, product, services or experience, and collecting additional data on the factors that contribute to those feelings or opinions. However, a Likert scale should only be used when the question items are related to each other and can be presented in a degree-scale form. Since respondents are not limited to a yes/no answer, a Likert scale allows researchers to obtain quantitative data that can be easily analyzed. Nevertheless, a Likert scale may be compromised because of “social desirability”. Social desirability is the bias exhibited by people to present themselves in a positive light in the community. For example, in taboo questions involving sex, illegal drugs, or racism, respondents may heighten “good behavior” or depress “bad” or undesirable behavior of their responses. One way to reduce social desirability bias is by allowing anonymity on self-administered surveys. A study by Paulhus (1984) found that when respondents have to put their name, address, and telephone number on the survey, results show more positive personality characteristics than an anonymous survey.  


4. How to create a Likert Scale

Establish the footing of your survey questions and response scale by first deciding what you want to measure. It is best to use a Likert scale when several factors are influencing the way your respondents feel about something. For instance, you want to measure patient satisfaction. Many factors affect patient satisfaction, including affordability, general behavior of doctors, amenities, and administrative procedures. The respondents’ opinions, attitudes, feelings, or experience must be measurable in a scale form. Moreover, make sure that there are two well-defined extremes for the response.  

For Example:

What is a Likert Scale


Recommendation

  • A Likert scale should have the same number of positive and negative responses.
  • Stay odd. Provide your respondents with a neutral option. 
  • Use the appropriate description to label response. When you just use numbers, people may obscure which end is affirmative and which is undesirable.
  • Make sure your survey questions are specific
  • Use terms that your target audience understands
  • Avoid bias questions
  • Avoid long and complicated questions
  • Avoid double-barreled questions

Check out our post on How to Write Great Survey Questions

You’ve most likely encountered Likert scale questionnaires without even knowing it. Likert scale questions are valuable for assessing people’s opinions on a specific topic when undertaking in-depth research. 

For more information on data collection techniques or any aspect of mail survey management, contact us today! We provide outstanding quantitative data collection services and paper scanning services!


Get more information on – survey research services incentive fulfillment services or survey mailing services

What’s the Difference Between Qualitative Research and Quantitative Research?

To understand a problem, large or small scale, both high quality and relevant data are needed. If you’re a researcher, you’ll have to collect this data using Qualitative Research or Quantitative Research methods. Without a solid understanding of the difference between qualitative and quantitative research, you risk using a less suitable method of data collection, impacting your results, and ultimately your study. 

In this post, we’ll discuss all the things you need to know about qualitative and quantitative research, their differences, and how to best use them for the success of your project. 

Content 

  • Definition of Qualitative and Quantitative Research
  • Table of Comparison of Qualitative and Quantitative Research
  • Key Differences and Example


Definition of Qualitative and Quantitative Research

Qualitative Research uses non-numerical measures to understand fundamental behavior, reasons, and motivations. Unstructured or semi-structured methods are utilized to gather insight into questions. This stage is often considered as the exploratory stage of research where freedom in response is implemented to gain an initial grasp of a problem.

Quantitative Research

  • For Example: An open dialogue with participants to find out why customer satisfaction ratings are low. Data from qualitative research can later be used to generate quantitative data to develop ideas or solutions. This is done by tallying the frequency of the qualitative result and determining the factors which are most relevant.


Quantitative Research is used to assess a subject by utilizing data that can be measured and then interpreted using statistical evaluations. Correspondingly, closed-ended questions are applied, and the target audience is given a set of options to use for responding. Quantitative data provides numerical facts!


Quantitative Research

  • For Example: The percent of people that find fulfillment in their job, or think their trainer is effective. The analysis of opinions, attitudes, and behaviors are simplified by using numerical data to draw conclusions, test a hypothesis, and discover trends in research. 


Table of Comparison of Qualitative and Quantitative Research

Quantitative Research

Key Differences and Example

The key differences between Quantitative and Qualitative Research are the purpose and methodology.

  • For Example: A School Board wants to find out how many of their students feel their teachers care about them. They use an in-house school survey composed of closed-ended questions to provide a numerical measurement. Let’s say the school finds out that 800 out of 1200 of the students don’t feel their teachers care about them. This is quantitative research. The purpose of quantitative research is to provide a concrete numerical measure by using the closed-ended methodology in order for the response of the students to be measured on a common scale. Furthermore, the school board decides to dig deeper into this issue. Consequently, they create a focus group discussion composed of 5 students from each class. The goal is to understand the key causes through open dialogue. The result of this research will be the opinions and statements of the chosen students. This is qualitative research. The purpose of qualitative research is to provide a deeper insight by looking at the human perspective, hence, using an open dialogue for respondents to sufficiently express themselves. 


Do You Need a Partner in Your Research?

Partner with DataForce Survey and Study Management

Our expertise in high-volume, paper-based, and multimodal data collection projects encompass the entire data collection supply chain. We can provide you with end-to-end data collection services, or participate in any part of the supply chain where you need assistance – from project scoping to form design to printing, mailing, fulfillment, data collection, data delivery, result reporting, and analytics. Contact us now!


For more information on Survey Mailing services and Data Collection Servicessurvey fulfillment services  Contact us Now!

By |2020-05-28T07:03:20+00:00May 11th, 2020|Survey Research Services, Uncategorized|0 Comments

How to Increase Mail Survey Response Rates

When you’re doing a Mail Survey Project, the last thing you want is to spend a lot of time and resources creating and sending a survey and get a low response rate. Without a sufficient response rate, results are questionable, and data quality is severely affected. To avoid this, we lined up some Best Practices in How to Increase Mail Survey Response Rate:


  1. A Compelling Cover Letter
  2. Reduce Length of Survey
  3. Use Reminder Postcards and Pre-Notification Letters
  4. Ensure Survey Return is Simple and Convenient
  5. Brand your Survey
  6. Use Incentives


1. A Compelling Cover Letter 

The cover letter should not be overbearing but instead a request for help. Emphasize your genuine appreciation for the time and effort of your potential respondents. A study has found that including the phrase “it would really help us out” can increase the survey response rate by 18%. A strong cover letter should include:

  • The purpose of the study
  • The materials included for returning the survey (e.g. return stamp and envelope or business reply envelope)
  • The confidentiality or anonymity of the survey 
  • The significance of a prompt response without being overbearing 
  • The benefits to the respondent 
  • The impact of the respondent’s feedback and how their opinion is valued
  • Contact information in case respondents have inquiries about the survey


2. Reduce Length

A long survey is an instant rejection by most respondents. A study has found that data quality reduces by more than 10% when the survey takes more than 15-20 minutes to complete. For example, respondents only filling out a portion of the survey. Hence, it is best to keep the survey at or below 15 minutes.


How to Increase Mail Survey Response Rates


3. Use Reminder Postcards and/or Pre-Notification Letters

Letting respondents know that you will be sending them a mail survey is an essential component in most survey projects. Notifications can include: sending an email, letter, or postcard in advance. The message should include the purpose of the survey, the survey process, and why the potential respondents’ participation is vital. 

Don’t forget the reminder postcard or letter.  According to Don Dillman (Dillman as cited in Fox, R.J., & Crask, M.R., & Kim, J. (1988). Mail Survey Response Rate. Public Opinion Quarterly, 52, 474) this approach allows you to express your sincere appreciation for the persons hopeful participation, but this also enables you to combat one of the most common reasons that people cite for not participating in a survey – they forgot! In fact, if your budget can absorb it, we have found that a common practice for survey research is to send a prenotification letter, followed by the survey packet, followed by a follow- up contact of some form which will give you 3 different occasions to interact with your hopeful participants. There are multiple studies that have shown a simple reminder can increase response rates by 10-30%.


4. Ensure Survey Return is Simple and Convenient

Survey return should be costless and hassle-free for respondents. Consider using prepaid return envelope for higher response rate and reduced follow up. 

How to Increase Mail Survey Response Rates

Use Return Postage. Enclose postage and an envelope in the survey material for the expected reply. The response rate increases significantly with the use of return postage. Moreover, using stamps on return envelopes has been shown to be better than business reply mail, however, the costs may outweigh the benefits.

Check out this link 3 Tips to Streamline Your Survey Return Schedule


5. Brand your Survey

Make sure respondents know who the survey is from. Include a return address and your logo to identify the sender. This will improve credibility and increase response rates.

How to Design a Survey Form (Easy 7 Step Process)


6. Use Incentives

Answering a survey takes time away from the busy schedule of your respondents. Make it worthwhile by providing value. Money, promotional items, charitable donations, and raffles are the top incentives that are proven to work and reach target response rates of more than 40%. 

  • Money – This should come as little surprise. Monetary incentives include cash, checks, PayPal credits, money orders, gift cards, and coupons.
  • Promotional Item- Product and service samples are also a big hit with respondents. In order for them to work, however, you must know your audience. Offer something that speaks to them that you know they will enjoy.  
  • Charitable Donations- Charitable donations appeal to social and environmental consciousness. The stronger the emotional connection to the cause, the better your response rate will be and the more likely respondents will see you in a favorable light. 
  • Raffle A drawing incentive gives your respondents a random chance to win a valuable prize, as opposed to a contest based on merit. They simply complete the survey and return within a given timeframe and they are automatically entered to win.

If you want to learn more about the incentives, check out our post on 3 Survey Incentives to Explode your Response Rate


Bonus Tips:

1. Multi-modal or Mixed-mode Data Collection  

To increase the response rate, consider using mail surveys with other channels, such as online. This is called a multi-modal survey. Basically, you use two or more modes to collect responses from potential respondents, giving them options to complete the survey with the mode that best suits them. 

Check out our post If you want to learn  When to do a Multimodal Survey

2. Express Mail

According to a study, express mail can increase the response rate, especially to executives and business respondents. Express mail is a good way to validate the importance of the survey response to potential respondents. 

There you have it, the 6 best practice and 2 bonus tips that will greatly influence your response rate. To ensure success, be sure to take a look at these tips before you send out your mail survey.


Partner with Us

DataForce is a premier data collection company specializing in Mail and Multi-modal Survey Management. We are the only data collection company in the industry with large-scale, in-house capabilities for every stage of your survey or study. Rather than outsource your project to various partners, DataForce can streamline your entire research effort with end-to-end planning, printing, mailing, fulfillment, data collection, and analytics – all done in-house! Our one-source solution is uniquely designed to align with your organization’s mission at the strategic level while saving you time, risk and money! From simple, short-term surveys to complex, longitudinal studies, DataForce technology is built to scale. DataForce is also a certified Woman Owned Small Business (WOSB), helping you meet diversity requirements.

For more information on Survey Mailing services and Data Collection Services, survey fulfillment services  Contact us Now!


By |2020-04-25T09:32:31+00:00April 15th, 2020|Survey Mailing Services|0 Comments

How to Design a Survey Form (Easy 7 Step Process)

Here’s the truth, answering surveys is not on the list of anyone’s most favorite thing to do- and without a good survey design your survey form might just end up in someone’s trash bin. The good news is, survey design is not rocket science, and it takes only a handful of simple steps and principles for you to make those dull couple of minutes of your respondent’s time a little bearable. So, if you’re ready to create a survey form that will actually be filled out by your desired respondents- check out this non-complicated 7-step process:

  • Step 1- Determine the research goals and list of objectives.
  • Step 2- Think about how you can keep your respondents honest and accurate.
  • Step 3- Keep in mind important Survey Principles before creating your questions.
  • Step 4- Structure questions that will produce all of the information you need.
  • Step 5- Create your Survey Form introduction.
  • Step 6- Select Survey Respondents sample size.
  • Step 7- Choose the best method to collect information.


Step 1 – Determine the research goals and list of objectives.

Once the survey questions are finished, review questions to ensure the data will answer your research goals and list of objectives. Eliminate questions that do not contribute to the end-goal and have a colleague review to validate your thoughts and ensure questions are not confusing.  


Step 2 – Think about how you can keep your respondents honest and accurate.

How to Design a Survey Form (Easy 7 Step Process)

  • a. If needed, give respondents the option of being anonymous. Some respondents might be hesitant in providing their most honest answer because of embarrassment, fear of judgment or reprimand.
  • b. Do not use too technical terms that might confuse your respondents. Choose the language that mirrors how the respondents truly think and talk regarding the topic.
  • c. Put easier questions first. Allow respondents time to become comfortable in answering the survey, in doing so, they will more likely answer the complex questions later.
  • d. Keep the survey short and simple. Consequently, this will ensure a higher response rate and limit survey fatigue. 


Step 3 – Keep in mind key Survey Principles before creating your questions.

How to Design a Survey Form (Easy 7 Step Process)

  • a.  Make sure each question is focused and designed for specific feedback.
    • Don’t use double-barrel questions: “How do you feel about our products and services?”
    • Instead, separate them into two questions: “How do you feel about our product?” and “How do you feel about our services?” These will provide an equal focus on both subjects.
  • b.  Questions should be grouped or ordered according to the subject.
  • c. Questions should be consistent.
    • For example: If you start with 1=low and 5=high, stick with that format.
  • d. Questions should be precise. Use actual numbers. Avoid generic answer choices like “sometimes” and “rarely” in the survey form.
    • For example: “more than 3 times per week”
  • e. Questions should be balanced. The number of positive and negative options should be equal.
  • f. Questions should be complete. Include all possible answers, and make sure there is no overlap between answer options.
  • g. Questions should be bias-free. Construct the questions as objectively as possible.
    • Avoid leading questions: “Can you see why this product was voted best in customer service?”
    • Instead, ask how they would describe their satisfaction level: “Please rate your satisfaction level in using this product.


Step 4 – Structure questions that will answer all of the information you need.

How to Design a Survey Form (Easy 7 Step Process)

  • Survey questions fall into two categories:
    • a. Structured or fixed response –  respondents choose from a provided list of answer options.
    • b. Non-structured or open-ended – respondents can fill in their own text or numeric answer.

Common Question Types:

  • a. Multiple Choice – These are questions with two or more answer options and is the most basic type of questions since respondents are limited to choices from the multiple answer options.  These are useful for collecting all kinds of demographic data.
  • b. Rating Scales – Rating scales ask respondents to rate how much they agree with a certain statement using a common scale (e.g. 1 to 5, where 1=low and 5=high). These are useful for gauging respondents’ opinions, attitudes, and behaviors.
  • c. Open-Ended Questions – These are questions with no provided answers options. Respondents answer by writing in their own text. These are great for eliciting responses about attitudes and opinions in a respondent’s own words or having them provide a numeric answer without a suggested range.

If you want to learn more about these question types check out our post on How to Write Great Survey Questions.


Step 5 – Create your survey form introduction.

  • a. Advise users of their privacy
  • b. Tell respondents how the data will be used
  • c. Don’t ask personal questions unless necessary
  • d. Give Clear instructions for completing the survey and how long it will take
  • e. If offered, clearly describe the incentive to increase the response rate.


Step 6 – Select Survey Respondents Sample Size.

How to Design a Survey Form (Easy 7 Step Process)

  • a. The target population and desired accuracy level will be the basis in choosing the sample size. Target Population is the total number of people you want to understand.
    • For example, you’re doing an employee satisfaction survey, and the company has 1000 employees; then 1000 is the population.
  • b. The Margin of Error – is how much error you can risk. Meaning if you have a margin of error of 5%, and the result of the survey shows 90% of the employees are happy- 85%-95% is the actual number. Simply, 5% is added and deducted on both ends.
  • c. Confidence Level – reflects that the respondents you chose mattered in the results you got. 95% Confidence interval means that you would get the same result 95% of the time and is the most commonly used.

From the chart table, you can determine your target population and then select the margin of error.


Population      

Margin of Error

     Confidence Interval
10% 5% 1%       90% 95% 99%
100 50 80 99        74 80 88
500 81 218 476        176 218 286
1,000 88 278 906        215 278 400
10,000 96 370 4,900        264 370 623
100,000 96 383 8,763        270 383 660
1,000,000+ 97 384 9,513        271 384 664


Check out this link for The DataForce Sample Size Calculator


Step 7 – Choose the best method to collect information.

Below are the most common types of survey distribution. Each survey method has its pros and cons that are affected by the budget, convenience, quality, and other considerations.

  • a. Online Survey– Services like Google Forms, Survey Monkey, Zoomerang, and many others have made online questionnaires very convenient to design and send. You can also use social media or your website to invite people to take surveys. An online survey is the most simple and cheapest survey to manage.
  • b. Face to Face or Telephone Interview – You have to create a script and train people for this kind of survey. This survey requires more effort and budget; however, you get in-depth answers that are most genuine.
  • c. Mail Survey– Despite being old school and having less control, many still opt to use mail surveys because it offers visual quality, looks professional, easy to administer, and not particularly costly.

Take note that you don’t have to choose one. In fact, for best results, it is encouraged to use several modes for survey administration.

Finally, you now have an actionable step-by-step process on how to create your survey form, including guiding principles to structure your questionnaire.  You’re on your way to producing a survey form that will deliver the quality data you need to make that outstanding research. But, perhaps you want to learn more about how to budget for your survey.

Check out this link on Overcoming Survey Budgeting Challenges

For more information on survey design or any aspect of mail survey management, contact us today! We provide outstanding Quantitative Data Collection Services and Paper Scanning Services!