Data Collection

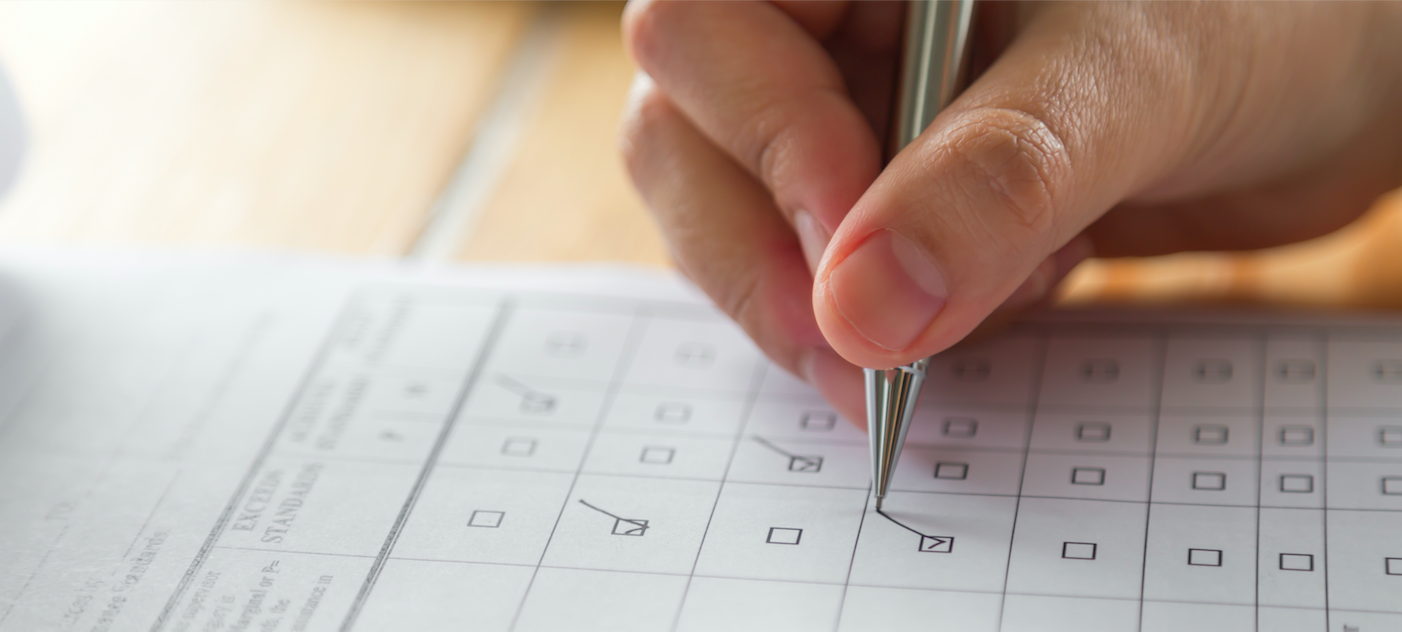
Reasons to Avoid Sending Mail Surveys During the Holidays

Many experts believe that the holidays are a bad time to ask people to participate in survey research, yet there are still some that will insist they’ve garnered better results during the holiday season. However, despite the success of some people in research during the holidays, we at DataForce Survey and Study Management still do not recommend sending mail surveys so close to the holiday. Below are two of the main reasons we urge you to think twice. 

1. People Are More Stressed During the Holidays

Avoid Sending Mail Surveys During the Holidays

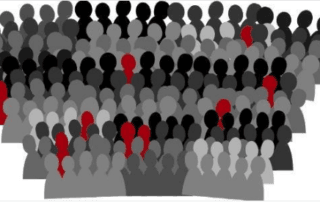
A 2015 Healthline survey that measured holiday stress confirms that the majority of respondents were under stress. According to the results of the survey, 65 percent of generation X, 61 percent of millennials, and 62% percent of baby boomers feel some stress during the holidays. 

When your audience is more stressed they are less likely to show interest in your mail survey. Their mind is more focused on picking the right gift, finances, holiday schedule, and so on. Although you may still receive survey response, it will undoubtedly be lower in quantity and quality than when your audience is in a period in time where they are under less pressure. 

2. A Quarter of Americans Plan to Travel During the Holidays 

Avoid Sending Mail Surveys During the Holidays

According to a survey of more than 1,000 adults conducted by Experian, 1-in-4 Americans plan to travel during the holidays. Among those leaving their home for some R and R, Gen X-ers and millennials will be the ones to travel the most. 38% of Millennials and 35% of Gen X-ers said they typically hit the road during the holiday season, while only 16% of Baby Boomers and 11% of Gen Z members said they travel at this time. During the holidays, your target audience might be out of their house. Your response rate will likely experience a decline by at least a few percentage points as a consequence. 

If you send out your packets during the holidays, there is also a good possibility that your respondents will leave their mail to pile up, and in an effort to catch up, throw out the ones that are least relevant into getting them back on track in their regular daily routine. Hence, the odds that your survey packet will be included with the mail thrown in the trash bin will be quite high. 

If you cannot avoid sending out that mail survey during the holidays, here are our recommendations:

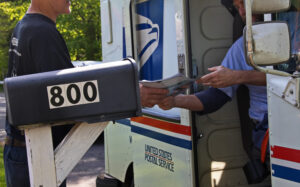
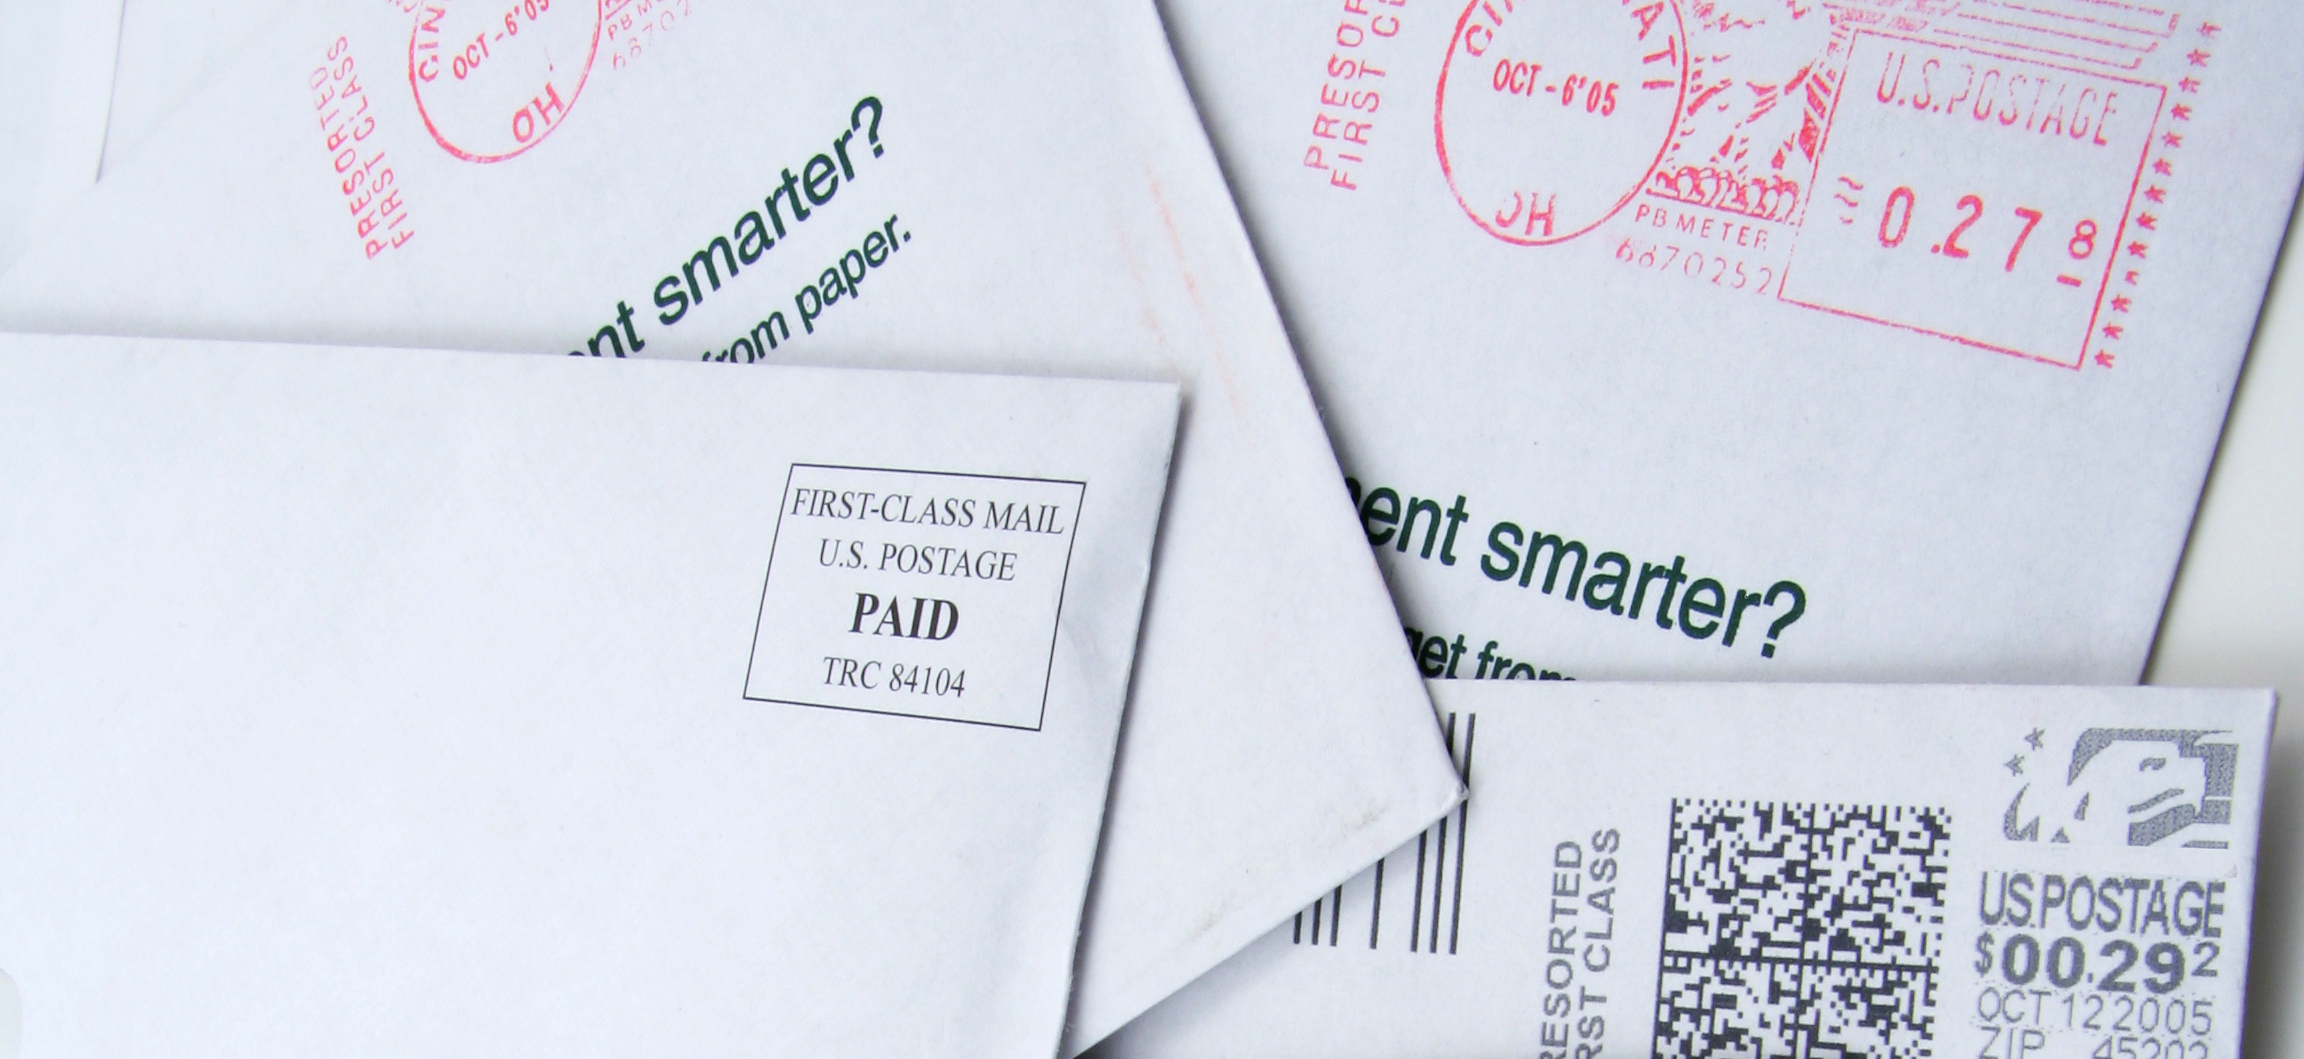
The delivery and return of holiday mail take longer. And, since potential participants are busy and distracted with the season, they tend to put off answering surveys. If you must send out your surveys during a holiday, allow additional time for returns. Most survey projects see the first set of results around 7 – 10 days after mailing, with the bulk of responses coming in between 14 – 18 days after the mailing date. If you are mailing your project around a holiday though, it is better to plan for an additional 1 – 2 weeks for responses, and expect them to be a little lower. 

Check out our post on 3 Tips to Streamline Your Survey Return Schedule

Sending mail surveys during the holidays is not the best idea or strategy to increase your response rate. However, we understand there are situations when you still have to take this course of action. Our mail survey experts at DataForce can help you plan, prepare, and execute your mail survey confidently and flawlessly during this period. For more information on survey fulfillment or any aspect of mail survey management, contact us today!


Check out – forms processing services, incentive fulfillment services

By |2020-06-21T15:36:42+00:00June 20th, 2020|Survey Mailing Services|0 Comments

Tips in Managing a Long Survey

One of the main reasons people don’t complete surveys is because they are too long and complicated. A long and complicated survey is like torture to potential respondents; it’s simply demotivating. If that’s what you’re aiming for, then go ahead and launch that survey. But I certainly don’t think that is anyone’s goal in creating their survey. So, if you’re struggling with a lengthy survey check out these tips and see how they can help you. 

Turn that Catastrophic Long and Complicated Survey into an Ideal Short and Clean Mail Survey

A long survey is an instant no-no for most respondents unless, of course, you are providing a significant incentive. And those respondents that do continue to answer a long survey, well, a study has found that after 15-20 minutes of answering survey questions, data quality is reduced by more than 10%. In short, a long survey can result in a reduction in response rate or data quality. To avoid this scenario, keep your survey length to no more than 15 minutes. Below are some tips to use when a long survey challenges you:

1. Categorize Questions into Crucial, Beneficial, and Expendable

Managing a Long Survey

Categorize your questions in relation to their necessity in answering the research goals and objectives:  Crucial, Beneficial, and Expendable questions. Crucial questions stay, and expendable questions are eliminated. In the middle are beneficial questions that assist in understanding the problem, but are not necessary for answering the objective and goals. They are temporarily removed and returned only when some room is left after all crucial questions have been listed. After the purging, the next step is to check the analysis of the survey, with and without the excluded questions.  This step is vital to determine if there will be a significant difference in the analysis after the changes. 

Moreover, think about adding the questions that were removed on a follow-up survey. A follow-up survey can be done through the same survey distribution method or something more convenient to the respondents, for example, online.

2. Multiple Survey Versions for Respondents

Managing a Long Survey

A second solution would be to create multiple versions of the survey. Let’s say you have 50 items on pharma products. You have 20 questions for your core questionnaire, and the remaining 30 questions are for three different products (10 questions each). Hence, you can create three versions of the questionnaire for each product. Each respondent will get the core questions and the questions for a single product. Consequently, you get data for all three products.  

Things to consider in creating multiple versions of the survey:

  1. Which respondent gets what survey should be picked randomly to avoid bias.
  2. Make sure that you have enough samples to ensure that you get enough responses for each version.

3. Utilize Background Variables

Managing a Long Survey

  • Don’t ask about things you already know and instead use it to your advantage. These are called “background variables”. When possible, it is best to filter your respondents with these variables. You don’t want to turn off respondents from answering a survey due to length when 20% of the questions don’t even apply to them. For example, you have a questionnaire where you want to determine the impact of medication to patients over 40, and 10% of the questions are only for patients who have done a particular treatment. If you have the list of the respondents who have had the treatment beforehand, you can provide the core questionnaire to all respondents and only offer the additional questions to the respondents who have had the treatment. This simple method can reduce survey rejection, as well as printing costs. You can also use the information you already have to personalize your materials (e.g., invite, cover letter, or survey).
  • Screen the answer list. If possible, respondents should only have response options applicable to them. For example, don’t provide feedback choices on the complete product list but only services applicable to the potential respondent.


A Checklist in Keeping your Mail Survey Clean and Simple

Managing a Long Survey

Keeping your survey clean and simple is crucial for respondents to comprehend questions and answer them accurately. If the survey questions are confusing, then the answers of the respondents may become distorted; hence, the research is compromised. To help you out, below is a Checklist in Keeping your Survey Clean and Simple: 

  1. Make sure the instructions are clear and accurate. Don’t make assumptions that the respondents already know what to do. Give examples.
  2. Avoid technical terms that will confuse your respondents. The language used should reflect how respondents think and talk regarding the subject.
  3. Easier Questions should come first. Place easier questions before the complex ones. Give respondents time to become comfortable answering the survey questions. In doing so, the probability of them answering the complex questions will increase.
  4. Each Question should be focused and intended for a particular feedback
    • Don’t use double-barrel questions:”
      • “Would you recommend our products and services to your friends?”
      • Instead, separate them into two questions:
        • “Would you recommend our products to your friends?”
        • “Would you recommend our services to your friends?”
        • These will provide an equal focus on both subjects.
  5.  Keep Questions precise. Actual numbers should be used. Avoid general response choices like “sometimes” and “rarely” in the survey form
    • For example: “less than 2 times per day”
  6.  Proofread the Survey. Check the survey for improper words, grammatical errors, and incorrect spelling. Mistakes such as this show unprofessionalism, and can devalue your survey. After proofreading the survey yourself, have someone else check it. Preferably, someone that is not familiar with your study, this process could flush out confusing terms or directions. You can also use special apps online, such as Grammarly proofreader.
  7. Test your Survey. Testing is a necessity despite how good you think your survey design and proofreading skills are. This is your last opportunity to fix errors before they become a big problem for your study.

There you have it. Effective Tips on How to Keep Your Mail Survey Short and Clean. And while they will certainly help improve your response rates, there are still other elements you might want to consider for a successful Mail Survey Project. Check out our Mail Survey Spec Sheet that will help you document the list size, number of mailings, type and quantity of materials that will be needed, budget and requirements for each mailing. This spreadsheet will help organize and calculate the materials across your mailings. Download the Spec Sheet here!

Partner with a Data Collection Solutions Provider

DataForce works with you to design forms that are ideal for obtaining the data you need. Our survey designers specialize in creating professional forms that are both functional and visually appealing and generate high response rates and impeccable results. We provide outstanding Survey Research Services and Survey Mailing Services.  Contact us now so we can help in the success of your Survey Project.

By |2020-06-20T18:09:03+00:00June 20th, 2020|Survey Mailing Services|0 Comments

What is the difference between First Class and Standard Class Mail?

One of the most common questions in Mail Survey budgeting is the kind of postage to use. Depending on your survey you may be able to cut on cost by using standard instead of first-class mail, however, think about this carefully, as you risk lowering survey response and reducing data quality. To help you decide, we’ve identified some key differences between the two. Choose the best one to fit your project.

The United States Postal Service (USPS) processes mail based on the mail type. The following are the most common types of mail. 

  •  Express Mail – Typically overnight services
  •  Priority Mail – Guaranteed delivery in 1-3 days depending on location
  •  First Class Mail
  •  Standard/Bulk Class Mail

Difference between First Class and Standard Class Mail


First Class Presort

First Class mail will be delivered in 1-2 days for local addresses and nationally; all of it should be delivered in about 4-5 days. If your party has moved and submitted a change of address with USPS, your mail will be forwarded at no cost for a period of 1 year. If it’s undeliverable, it will be returned at no cost with the reason why it could not be delivered.

The mail file must have at least 500 records, be NCOA address updated, CASS certified, and put in presort order before being delivered to the postal service. Typical savings off of list rates depend on the zip code sort; you can expect to save 10-20%. 


Standard Class (formerly known as Bulk Mail)

There is a significant saving using Standard Class mail (aka Bulk mail). Standard mail is processed by the USPS on a “time available” basis. There is NO guaranteed delivery time, only “typicals.” Local mail is typically delivered in about 3-6 workdays, and national mail can be 1-3 weeks. Sometimes it’s faster, and other times it’s slower. Just remember there is no guarantee, and mail is processed as they have time. In our experience, we see longer delays around the holidays. 


  • The “pros”: It’s the least expensive postage mode, almost half the price of 1st class, which enables you to mail a higher volume for less. It also allows up to 3.3 ounces, all for the same low postage rate.  


  • The “cons”: Due to the delivery time, NEVER use Standard mail if you have a rapidly approaching event or expiration date. Standard mail is not forwarded and usually not returned if undeliverable. It merely goes into the USPS recycling bin. Standard Class mail requires a minimum of 250 pieces to qualify for these rates.


Partner with DataForce

Managing a mail survey project can be overwhelming when you have different vendors to deal with. Streamline your project by partnering with a data collection expert that can handle all your needs. Our one-source solution is uniquely designed to align with your organization’s mission at the strategic level while saving you time, risk, and money! For more information on data collection or any aspect of survey mail management, contact us today!

By |2020-05-24T19:21:21+00:00May 24th, 2020|Survey Mailing Services|0 Comments

What Survey Mode is Best for My Project

While there are many tools available for data collection, surveying is one of the most commonly used. Surveying is essentially a research method used to gather data from a sample of people to generalize results to a larger population and gain insights on various topics. Questionnaires are used in asking people for information in a survey. As compared to other data collection methods, such as direct observation and experimentation, surveys yield a broader range of information. The most common survey types by distribution are online, telephone, face-to-face, and mail survey.


Types of Survey


1. Online Survey

Different Types of Survey


Technology has enabled online surveys to become the most popular and cost-effective type of survey. The questionnaire can be completed with a smartphone, tablet, or computer so long as the respondent has access to the internet. 

a. Advantages: 

  • Reach of the survey has increased to wherever there is internet access.
  • No limit to the type of questions that can be asked.
  • Data collection and data analysis is now structured and easy to manage.
  • Ideal for short, simple surveys.
  • Quick results.

b. Disadvantages:

  • We receive requests to take online surveys frequently, whether you make a purchase from Amazon, pick up lunch at McDonald’s or take a class; everyone wants us to take their online survey. This saturation has contributed to survey fatigue, and people are only doing online surveys if they are unhappy or related to something meaningful to them.
  • Inboxes are inundated nowadays; we are busy looking for the things that need our attention and delete or skip the other ‘stuff.’
  • People are hesitant to click on links that come from people they don’t know, they don’t want their information stolen or their computer hacked. 


2. Telephone Survey


The medium used to contact respondents is the telephone. An interviewer follows a script in asking a specific set of questions to the respondents, and a data entry software is used to record the respondent’s answers. 

a. Advantages:

  • Relatively cheaper and less time consuming than face to face surveys. 
  • Extensive geographic access since most people in the United States have a telephone or cellphone. 
  • Easy access to in-house or online phone directories. Phone numbers can easily be purchased from sample companies. 
  • Time effective since interviewers can just keep calling numbers until they reach their quota.
  • Skilled interviewers can elicit longer or more complete answers. Interviewers can also ask for clarifications of unclear responses.  

b. Disadvantages:

  • Hard to make a connection with people since interviewers can’t see the person’s reaction. 
  • Intrusive, since most of the time, telephone surveys are done without notice. The interviewer might be interrupting the respondent’s plan for the day. The researcher must carefully consider the time and length of the call.
  • Interviewers may be perceived as telemarketers and, consequently, turn-off respondents. 
  • Regulations must be followed to avoid significant fines.


3. Face-to-Face Interview

Different Types of Survey


Face-to-Face surveys are one of the oldest and most widely used survey types. The researcher typically interviews in the home, office, hangout place, etc. of the target respondent. This is by far the most personal approach and best used if you are looking to raise trust and cooperation from respondents. Interviewers must be trained well, including on how to read non-verbal cues to direct the interview better.

a. Advantages  

  • Can capture verbal and non-verbal cues. The interviewer can gauge if body language and facial expressions match the participant’s answer.
  • The interviewer can make sure that the participant is committed and encouraged to finish the survey.
  • The interviewer can provide assistance in case the participant is confused about any part of the survey or question.
  • The interviewer can take advantage of the five senses. Aside from audio and visual stimuli, the researcher can also let respondents touch, taste, and smell materials to support the interview.

b. Disadvantages

  • A face-to-face survey can take longer. Interviews can last for days or weeks, depending on the number of respondents needed and their availability.
  • Considerably more expensive than paper, online, and telephone. Training, travel, and material are some of the principal costs. 
  • The quality of data depends on the skill of interviewers. 
  • It requires more effort to plan and manage.


4. Mail Survey 

Different Types of Survey


For reasons of cost and ease of implementation, mail surveys are more frequently used for social research than are either telephone or face-to-face interviews, according to Don Dillman.  Before online surveys, 69% of surveys were conducted solely by mail and another 11% were a combination of mail and some other mode. 

a. Advantages

  • It can be used when the respondent’s internet access or knowledge is limited.
  • Less expensive than Face-to-Face or Telephone surveys.
  • Allows respondents to complete the survey at their convenience. 
  • A hard copy serves as a reminder to finish the survey.
  • Research shows that respondents give more honest answers when compared to other modes.
  • Respondents trust mail surveys more than online surveys since we are told not to click on links from people/organizations that we don’t know. 
  • You have less competition with someone’s mailbox than you do with their inbox.
  • Best for capturing sensitive information or long, complex surveys.

b. Disadvantages

  • Respondents may not follow directions or only answer certain questions, leaving an incomplete response.
  • It takes more time than online surveys to collect the data.
  • If your study requires alternate question sets or alternating question order, paper surveys may be too costly to support this requirement.

Check out our earlier post on Why Mail Surveys are Thriving in the Digital Age.


How to Select the Best Survey Type for Your Research


1. Consider Population and Sampling

Define the characteristics of the target respondents that belong to your population before you choose a survey method. Determine geographics, language, communication, literacy, and other issues that might arise. For example, if your target respondents are older people, you may choose a mail survey; however, if the target population is younger or more tech-savvy, an online survey might be more appealing.  

2. Determine Question Types 

In selecting the right survey method, the questions that the respondents need to answer should be considered. Paper or mail surveys can be ideal for mostly closed-ended questions, while a survey with plenty of open-ended questions that could require a follow-up may require a face-to-face or telephone interview.  

3. Check your budget

You have to justify the cost of the type of survey you will choose. You may want to do a face-to-face interview, but the costs compared to a mail survey may not validate the benefit of pursuing face-to-face interviews. 

4. Establish your timeline

Some survey methods take longer to complete than others. If you are in a rush, then an online survey is your best bet. However, if time is not a significant factor, then you can do a mail survey.

5. Check Access to Facilities and Resources

Do you have the facilities, equipment, and human resources needed for your survey to run smoothly? If you plan to do a mail survey, you need access to printers, human resources or equipment for stuffing envelopes, data processing software, warehousing, and so on. For telephone surveys, you need well-trained interviewers, phone equipment, CATI software, etc.  

It’s important to know which survey type to use and when to use it. Once you’re familiar with the different survey types, you’ll be able to focus on what you need to make your survey distribution as smooth as it can get, getting you far better results than ever before. For more information on data collection techniques or any aspect of mail survey management, contact us today! We provide outstanding quantitative data collection services and paper scanning services!

By |2020-05-19T21:44:22+00:00May 19th, 2020|Survey Research Services|0 Comments

What is a Likert Scale and How to Create One

Are you interested in finding out what you can use to measure questions that are neither agreed nor disagreed? A Likert scale can help you measure attitudes and opinions with a greater degree of nuance than simple binary questions, which offer only two answer options. Please read our blog post to learn what is a Likert scale and how to create one for your next survey.

1. What is a Likert scale? 

The Likert scale is one of the most popular rating scales developed to measure one’s attitudes or opinions. Fixed choice response formats are used to determine how people feel about the topic, products, services, or experience. The scale deems that the strength/intensity of the experience is linear. These linear scales measure points of agreement/disagreement. People are given five to seven choices, or even nine balanced responses, that often come with a neutral point. 


2. Common Likert Scale Question

A Likert scale does not have a fixed number of leveled items. Many researchers use five levels, but some also use 4, 7, 9, and even 10-leveled items. Since adding more levels produces diverse valuations, a 5 or 7 level scale is most often ideal for avoiding extreme options by obtaining just a bit of variation.

Below are some examples of Likert scale questions and answers:

a. Agreement

The employee training provided the knowledge I need to do my work efficiently.

  • Strongly Disagree
  • Disagree
  • Undecided
  • Agree
  • Strongly Agree

b. Satisfaction

How satisfied are you with our customer support?

  • Highly Dissatisfied
  • Dissatisfied
  • Neutral
  • Satisfied
  • Highly Satisfied

c. Frequency

How often do you visit our store?

  • Very Frequently
  • Frequently
  • Occasionally
  • Rarely
  • Never


3. When to Use Likert Scales

What is a Likert Scale

Likert scale is useful in measuring the general feeling or opinion of a particular topic, product, services or experience, and collecting additional data on the factors that contribute to those feelings or opinions. However, a Likert scale should only be used when the question items are related to each other and can be presented in a degree-scale form. Since respondents are not limited to a yes/no answer, a Likert scale allows researchers to obtain quantitative data that can be easily analyzed. Nevertheless, a Likert scale may be compromised because of “social desirability”. Social desirability is the bias exhibited by people to present themselves in a positive light in the community. For example, in taboo questions involving sex, illegal drugs, or racism, respondents may heighten “good behavior” or depress “bad” or undesirable behavior of their responses. One way to reduce social desirability bias is by allowing anonymity on self-administered surveys. A study by Paulhus (1984) found that when respondents have to put their name, address, and telephone number on the survey, results show more positive personality characteristics than an anonymous survey.  


4. How to create a Likert Scale

Establish the footing of your survey questions and response scale by first deciding what you want to measure. It is best to use a Likert scale when several factors are influencing the way your respondents feel about something. For instance, you want to measure patient satisfaction. Many factors affect patient satisfaction, including affordability, general behavior of doctors, amenities, and administrative procedures. The respondents’ opinions, attitudes, feelings, or experience must be measurable in a scale form. Moreover, make sure that there are two well-defined extremes for the response.  

For Example:

What is a Likert Scale


Recommendation

  • A Likert scale should have the same number of positive and negative responses.
  • Stay odd. Provide your respondents with a neutral option. 
  • Use the appropriate description to label response. When you just use numbers, people may obscure which end is affirmative and which is undesirable.
  • Make sure your survey questions are specific
  • Use terms that your target audience understands
  • Avoid bias questions
  • Avoid long and complicated questions
  • Avoid double-barreled questions

Check out our post on How to Write Great Survey Questions

You’ve most likely encountered Likert scale questionnaires without even knowing it. Likert scale questions are valuable for assessing people’s opinions on a specific topic when undertaking in-depth research. 

For more information on data collection techniques or any aspect of mail survey management, contact us today! We provide outstanding quantitative data collection services and paper scanning services!


Get more information on – survey research services incentive fulfillment services or survey mailing services

What’s the Difference Between Qualitative Research and Quantitative Research?

To understand a problem, large or small scale, both high quality and relevant data are needed. If you’re a researcher, you’ll have to collect this data using Qualitative Research or Quantitative Research methods. Without a solid understanding of the difference between qualitative and quantitative research, you risk using a less suitable method of data collection, impacting your results, and ultimately your study. 

In this post, we’ll discuss all the things you need to know about qualitative and quantitative research, their differences, and how to best use them for the success of your project. 

Content 

  • Definition of Qualitative and Quantitative Research
  • Table of Comparison of Qualitative and Quantitative Research
  • Key Differences and Example


Definition of Qualitative and Quantitative Research

Qualitative Research uses non-numerical measures to understand fundamental behavior, reasons, and motivations. Unstructured or semi-structured methods are utilized to gather insight into questions. This stage is often considered as the exploratory stage of research where freedom in response is implemented to gain an initial grasp of a problem.

Quantitative Research

  • For Example: An open dialogue with participants to find out why customer satisfaction ratings are low. Data from qualitative research can later be used to generate quantitative data to develop ideas or solutions. This is done by tallying the frequency of the qualitative result and determining the factors which are most relevant.


Quantitative Research is used to assess a subject by utilizing data that can be measured and then interpreted using statistical evaluations. Correspondingly, closed-ended questions are applied, and the target audience is given a set of options to use for responding. Quantitative data provides numerical facts!


Quantitative Research

  • For Example: The percent of people that find fulfillment in their job, or think their trainer is effective. The analysis of opinions, attitudes, and behaviors are simplified by using numerical data to draw conclusions, test a hypothesis, and discover trends in research. 


Table of Comparison of Qualitative and Quantitative Research

Quantitative Research

Key Differences and Example

The key differences between Quantitative and Qualitative Research are the purpose and methodology.

  • For Example: A School Board wants to find out how many of their students feel their teachers care about them. They use an in-house school survey composed of closed-ended questions to provide a numerical measurement. Let’s say the school finds out that 800 out of 1200 of the students don’t feel their teachers care about them. This is quantitative research. The purpose of quantitative research is to provide a concrete numerical measure by using the closed-ended methodology in order for the response of the students to be measured on a common scale. Furthermore, the school board decides to dig deeper into this issue. Consequently, they create a focus group discussion composed of 5 students from each class. The goal is to understand the key causes through open dialogue. The result of this research will be the opinions and statements of the chosen students. This is qualitative research. The purpose of qualitative research is to provide a deeper insight by looking at the human perspective, hence, using an open dialogue for respondents to sufficiently express themselves. 


Do You Need a Partner in Your Research?

Partner with DataForce Survey and Study Management

Our expertise in high-volume, paper-based, and multimodal data collection projects encompass the entire data collection supply chain. We can provide you with end-to-end data collection services, or participate in any part of the supply chain where you need assistance – from project scoping to form design to printing, mailing, fulfillment, data collection, data delivery, result reporting, and analytics. Contact us now!


For more information on Survey Mailing services and Data Collection Servicessurvey fulfillment services  Contact us Now!

By |2020-05-28T07:03:20+00:00May 11th, 2020|Survey Research Services, Uncategorized|0 Comments

How to Pick the Right Respondents for Your Survey

In our blog on Choosing the right sample size”, we provided a formula to ensure your target population is represented accurately. Knowing that number early is important for determining your mail quantity and bidding out your project to vendors. However, it is only half the equation in survey sampling. The other half is making sure you pick the right people.  

So how do you choose the participants? 

1. Define Your Target Population

Before you can choose survey participants, you need to define the common binding characteristics or traits of the overall population. For example, “government employees” or “existing customers.” These are often combined with other characteristics: “government employees who use iPhones” or “existing customers who have utilized a particular service.” It is imperative to select the most appropriate target population to satisfy the objectives of the survey. 


2. Identify Your List Source

Some survey samples are easier to generate than others. For example, if you are surveying your existing customers, you likely already have everything you need in your company database. But if your target is “Latina women 25-40 who shop online,” you may have some work to do. In this case, you may want to look for available public data or purchase a list from a sample provider. Once you determine the list you need, then you become better positioned to choose a sampling method and pick your respondents. 


3. Choose a Sampling Method

There are many scientific ways to select a sample. They can be divided into two groups: probability and non-probability sampling. Probability sampling is any method that utilizes random selection like drawing straws or randomized computer selection. Everyone in a target group has an equal probability of being chosen. It is the preferred method of researchers because it accounts for bias and sampling error. 

But sometimes probability sampling is not feasible, either due to time constraints or list accessibility. In that case, non-probability sampling is used. People must still meet common binding criteria, but they are chosen in such places as a mall or a busy neighborhood. Such samples are often useful but don’t account as easily for bias and sampling error. 

Depending on the needs of your study, you will typically choose from one of the following common methods:

  1. Random SamplingThe purest form of probability sampling. The most basic example of this technique would be the lottery method.
  2. Stratified SamplingIdentifies a subset of the target population such as fathers, teachers, females, etc., and selects them at random.
  3. Systematic SamplingUses every Nth name in a target list, where N is a variable of your choosing.
  4. Convenience SamplingA non-probability method used when only a few members of the target population are available. 
  5. Quota SamplingUses subset criteria like stratified, but doesn’t randomize their selection. 
  6. Purposive Sampling A method that uses predefined criteria with a purpose in mind. For example, gauging the perceptions of Caucasian females between 30-40 years old on a new product but not randomize their selection.

Survey sampling is a critical part of data collection. Your survey provider can help you weigh these options for your survey to ensure you get the quality data you need. For more information on survey sampling or any aspect of mail survey management, contact us today!

By |2020-03-30T19:45:29+00:00January 13th, 2020|Survey Research Services|0 Comments

Automated Data Collection: Which Approach is Best?

Long gone are the days when mail survey responses were collected manually and key entered into digital format. Today, the question isn’t whether you should automate, but rather which automated data collection approach you should be using.

The most commonly used data capture technologies in the survey industry today are OMR (optical mark recognition) and Image Scanning, each with inherent advantages and disadvantages. While both provide exceptional accuracy and cost efficiency, OMR is significantly faster while Image Scanning offers more flexibility.

Choosing a data collection technology for your project is something you will need to do early in the planning process before your survey forms are designed. Your survey research partner can help you determine which solution will work best for your unique project.

Following are detailed descriptions of these industry-best quantitative data collection technologies:

OMR Technology

OMR technology detects the absence or presence of a mark. It is the fastest data collection technology in the industry and is particularly adept at measuring the darkness of a mark to help determine whether the mark is a valid response or an erasure. OMR is commonly used in standardized school testing such as the fill in the bubble test forms.

OMR forms are very specialized documents that require critical registration. This means that the forms must include precise “timing marks” along the edge of the form to let the OMR scanner know where to look for data. If this is not done correctly, data collection will be adversely affected. Therefore, you must work with a printer who has experience with OMR forms.

Color is also extremely important with OMR documents. Only colors that contain no black as part of their PMS color can be used. If a pen will be allowed, only various shades of red can be used, which further limits color choices. In addition, the paper stock requires the proper reflectance and fluorescence so that it will not read false marks during the data collection process.

As the forms are being scanned, the data is immediately written to the data file. OMR scanning has an accuracy rating of 99.9%, but only when the forms are filled out correctly. Respondents need to use the correct writing instrument and fill the bubbles completely to achieve this type of accuracy rating.

A drawback to OMR technology is that it requires you to produce pre-printed documents, which some clients have found to be inflexible, costly (especially with small quantities) and incapable of meeting design change requirements on short notice.

Image Scanning Technology

Image scanning uses ‘mark sense technology’ to detect marks on a form. While it looks a lot like OMR (collecting data from multiple choice questions), mark sense technology is very different. Rather than look for marks on a form, the scanner takes a bi-tonal (black and white) image of each form field and looks for differences in pixels between the scanned image and a template, revealing the marks in the process.

  • Time

Image scanning does take longer to process. This is because images are taken of each page, then processed against a pre-programmed template, called a document definition. Any fields that fall outside the tolerance are routed to a human verifier who reviews the field on screen and makes the appropriate choice based on the rules that have been established. Only after this step will the data be written to the data file. Testing has shown that image scan processing can take up to 40% longer than OMR depending on the rules established.

  • Flexibility

However, image scanning is much more flexible than OMR. The biggest advantage is during printing, as image scanning does not require special ink colors or the critical registration that OMR must have. Forms can be printed in black and white, and images can be stored and indexed off of any field that is collected during the scanning process.  

Forms can also include fields for open-ended comments (i.e, handwriting) that will be captured using a combination of ICR (Intelligent Character Recognition) software and operator review. Rules can also be established that force a field to be reviewed by an operator for editing. For example, all blank responses should be inspected. This is a popular rule for tests administered to young students who may have circled the choice vs marking the bubble. Other popular rules that are established for human editing include double marks, light marks that do not meet the minimum threshold, missing responses, invalid ID’s, out-of-range marks, and more.

Although the processing takes longer, we have found Image Scanning data to be more accurate than that of OMR because of the operator intervention with the form. While using an operator will certainly increase the cost of collecting data, the flexibility and increased accuracy may be worth it for your project!

 Automated Data Collection - Quick Reference Chart

Summary

OMR and Image Scanning are the best-automated data collection technologies in the industry today. Because of its inherent flexibility, Image Scanning is the more commonly used option. But for those that can adhere to OMR’s strict requirements, there is no faster or more accurate fully-automated way to collect data for multiple choice only questions.

When you do decide what automated data collection approach your project will need, one of the first things you need to prep for is a blueprint of what all the numbers mean in the data file you will get with your results. This is called a Data Schema. Check out our blog post on Creating a Data Schema

For more information on automated data collection, data capture services, or any aspect of mail survey management, contact us today!

By |2019-05-24T19:57:48+00:00September 13th, 2018|Data Capture Services|0 Comments

Choosing the Right Sample Size

Choosing the right sample size is vital to accurate survey outcomes. With the right number of survey respondents, your target population will be represented with acceptable accuracy.  Although it may seem like a simple undertaking, you must put a lot of thought into determining your survey’s most effective sample size.

In most cases, the larger your sample size, the more confident you can be that the responses you receive reflect the total target population. However, there is another side to that coin. Deciding on a larger sample size requires you to distribute more surveys, and that drives up the cost of your survey project.  

It’s not as simple as randomly selecting a large sample size and assuming that will equate to successful response rates. The pitfall of using no forethought when selecting a sample size is that you may select a sample that is not statistically significant or will cause you to exceed your budget. To arrive at your optimum sample size, you must start by asking a few key questions.

1. How Large Is Your Target Population?

Choosing the Right Sample Size - How large is Your Target Population

You can begin to understand your sample size needs by first determining the size of the total population of possible respondents. If you want to understand something more large-scale, such as how grocery shoppers are using mobile devices, you will need to use a larger sample size. That’s because there are millions of grocery shoppers who use mobile devices. On the other hand, if you want to assess a smaller, more specific group, such as the opinions of the faculty at a particular university, the population is limited to a few thousand or even a few hundred.

2. How Accurate Do You Need to Be in Choosing the Right Sample Size?

Because you are only using a small sample group out of a larger target population, you must now make some decisions about accuracy. Your accuracy will depend on choosing an acceptable margin of error and accepted confidence level.  

Your margin of error measures how well the responses from your sample reflect the opinions of your entire target population. A commonly chosen margin of error is 5%. You must also keep in mind that lower margins of error require a larger sample size.

Your confidence level represents the degree to which your sample is an accurate sample of the population. If you decide your project requires a 95% confidence level, you are declaring that if you repeated your survey, you would get the same results 95% of the time. Higher confidence levels require a larger sample size.

3. What Is Your Expected Response Rate?

Arriving at an answer to the first two questions is relatively straightforward. First, determine the size of your target population. Then decide how accurate you want your survey results to be.

Now, on to the challenging part: estimating what your response rate will be. Estimating your response rate is often difficult; there are many factors that contribute to a respondent’s decision to complete and return your survey. The list of factors includes:

    • Questionnaire length
    • Question complexity
    • Importance of the survey to the respondent
    • Level of respondent interest in the survey
    • Availability of incentives

Fortunately, you are in control of most of these factors. Depending on your target population and the decisions you make about how you will administer your survey, your response rate can range from 1% to 60%. Lower expected response rates require a larger sample size.

For more tips on Survey Design, check our blog post on How to Write Great Survey Questions

Working with an Experienced Survey Administration Partner in Choosing the Right Sample Size

Your sample size has a direct impact on the validity and cost of your survey. Consequently, it’s crucial that you get that number right. Once you have determined the right sample size for your survey, there’s still more work to do. How will you distribute the surveys? How will you gather them and analyze the outcomes?  

This is where your survey administration partner can add value to the process. When you work with an experienced vendor, they can consult with you about the nature of your survey research and suggest choices that will help you achieve your goals in an efficient and cost-effective manner.

Your partner can help you measure your target population and decide on an appropriate margin of error and confidence level. In addition—although no two survey projects are ever exactly alike—your partner can rely on their experience with working with a wide range of organizations and projects to help predict what your response rate might be.

When you are planning your next survey project—and trying to understand your optimal sample size—consider getting help from an experienced survey administration partner.

If you’d like more information on incentives, project consulting services, survey research services, incentive fulfillment or survey mailing services in general, contact us today!

By |2019-05-24T19:47:16+00:00March 6th, 2018|Survey Research Services|0 Comments